 |
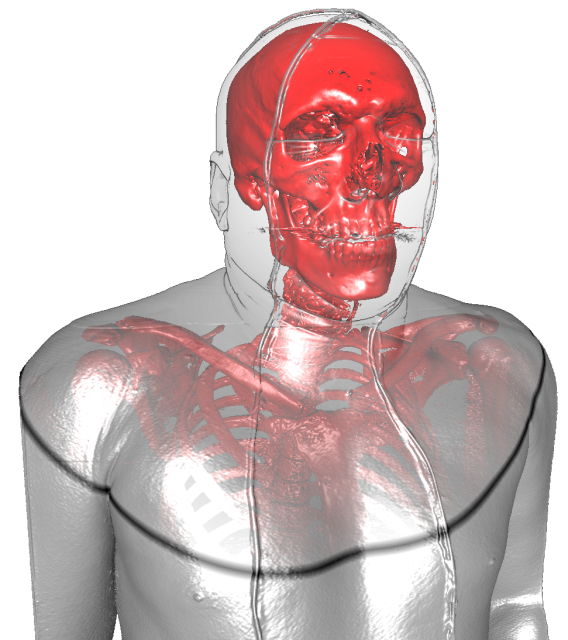
| Figure from T. Fogal and J. Krüger, a Clearview rendering of the visible human male dataset |
As data sizes grow, the amount of information resident in those data grows proportionally. Visualizations of these large datasets are correspondingly dense in their complexity, causing the viewer to be lost in a sea of data. This can cause important features to be drowned out by surrounding data, making the viewer focus on aspects of the data which are relatively unimportant. 'ClearView' is a reaction to the complexities of the images generated by modern volume rendering tools. It was designed to follow the 'focus and context' model of visualization, in which we focus our attention on an area of interest while maintaining the relevant context of spatially related data. The result is a very simple tool which users can grasp, manipulate, and use to understand their data quickly and easily. Images are generated based on the ClearView lens, which the user moves through the dataset to look inside at values of interest. Even though context information is dissolved to allow viewing inner portions of the dataset, small scale structures of the context data are preserved to allow one to easily infer the relationship between the 'focus' and 'context' data.
At its core, ClearView is a rendering mode which allows the simultaneous viewing of two isosurfaces: an inner, or 'focus' isosurface, and an outer, or 'context' isosurface. ClearView renders the two surfaces independently and then composites them together based on the position of the ClearView lens. The lens dictates the behavior of the compositing: near the center of the lens, the 'focus' isosurface dominates the rendering. As the distance increases radially from the center of the lens, the 'context' isosurface is weighted more prominently. Thus it appears as if the 'focus' isosurface is gradually occluded by the 'context' isosurface. Yet ClearView provides more than just a rendering of two isosurfaces. To better highlight the important context information available in the dataset, distinct features in the context isosurface are preserved even if the lens is focused on those features. In the depicted implementation, areas of high curvature are preserved. Real time feedback of malleable rendering parameters is critical for exploratory visualization systems]. Due to the importance of this style of interaction, ClearView is implemented to take advantage of the advanced parallel computation capabilities of modern GPU's. This design choice, coupled with an appropriate out of core renderer [2], allows ClearView to render data of immense sizes at hundreds of frames per second.
 |
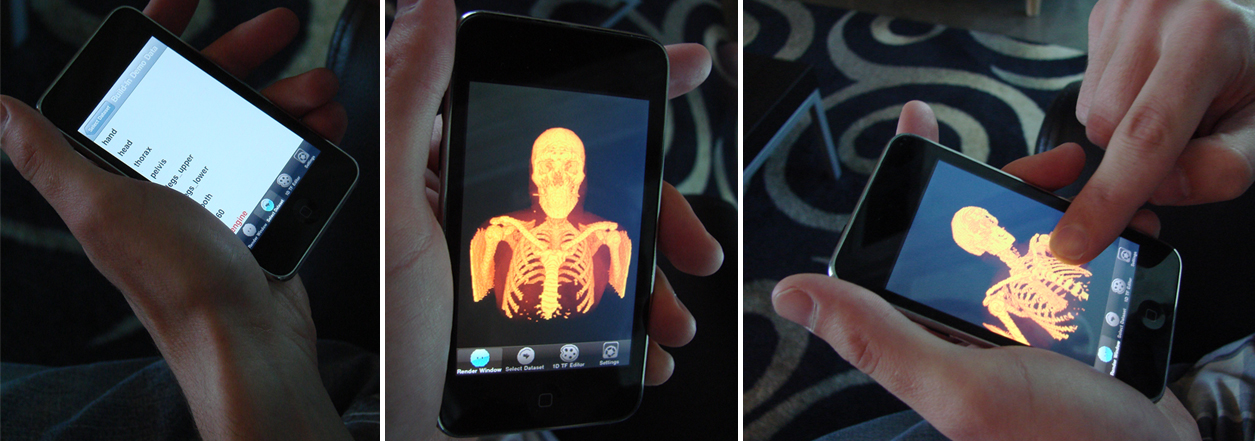
| Screen shots from the iPhone platform using ImageVis3D mobile which incorporates the Clearview rendering technology |
ClearView is available within the ImageVis3D and ImageVis3D Mobile (freely available from the iTunes apps store for both the iPhone and iPad) distributions, as such the user selects an outer isovalue, which determines the surface rendered for the 'context' isosurface. Then the user places a lens over the data which depicts the location where the inner surface will show through. Finally, the user customizes a second isovalue, in turn selecting the inner or 'focus' isosurface. This makes an intuitive interface to create informative visualizations, as has been shown in previous work.
Applicable Publications
T. Fogal and J. Krüger, Focus and Context - Visualization without the Complexity, Book Series, IFMBE Proceedings, Volume 25/13, World Congress on Medical Physics and Biomedical Engineering, September 7 - 12, 2009, Munich, Germany, Publisher Springer Berlin Heidelberg, 2009T. Fogal and J. Krüger, Size Matters - Revealing Small Scale Structures in Large Datasets, Book Series, IFMBE Proceedings, Volume 25/13 World Congress on Medical Physics and Biomedical Engineering, September 7 - 12, 2009, Munich, Germany, Publisher Springer Berlin Heidelberg
