SCI Publications
2012
S. Kole, N.P. Singh, R. King.
“Whole Brain Fractal Analysis of the Cerebral Cortex across the Adult Lifespan,” In Neurology, Meeting Abstracts I, Vol. 78, pp. P03.104. 2012.
D. Kopta, T. Ize, J. Spjut, E. Brunvand, A. Davis, A. Kensler.
“Fast, Effective BVH Updates for Animated Scenes,” In Proceedings of the Symposium on Interactive 3D Graphics and Games (I3D '12), pp. 197--204. 2012.
DOI: 10.1145/2159616.2159649

S. Kumar, V. Vishwanath, P. Carns, J.A. Levine, R. Latham, G. Scorzelli, H. Kolla, R. Grout, R. Ross, M.E. Papka, J. Chen, V. Pascucci.
“Efficient data restructuring and aggregation for I/O acceleration in PIDX,” In Proceedings of the International Conference on High Performance Computing, Networking, Storage and Analysis, IEEE Computer Society Press, pp. 50:1--50:11. 2012.
ISBN: 978-1-4673-0804-5
Hierarchical, multiresolution data representations enable interactive analysis and visualization of large-scale simulations. One promising application of these techniques is to store high performance computing simulation output in a hierarchical Z (HZ) ordering that translates data from a Cartesian coordinate scheme to a one-dimensional array ordered by locality at different resolution levels. However, when the dimensions of the simulation data are not an even power of 2, parallel HZ ordering produces sparse memory and network access patterns that inhibit I/O performance. This work presents a new technique for parallel HZ ordering of simulation datasets that restructures simulation data into large (power of 2) blocks to facilitate efficient I/O aggregation. We perform both weak and strong scaling experiments using the S3D combustion application on both Cray-XE6 (65,536 cores) and IBM Blue Gene/P (131,072 cores) platforms. We demonstrate that data can be written in hierarchical, multiresolution format with performance competitive to that of native data-ordering methods.
A.G. Landge, J.A. Levine, A. Bhatele, K.E. Isaacs, T. Gamblin, S. Langer, M. Schulz, P.-T. Bremer, V. Pascucci.
“Visualizing Network Traffic to Understand the Performance of Massively Parallel Simulations,” In IEEE Transactions on Visualization and Computer Graphics, Vol. 18, No. 12, IEEE, pp. 2467--2476. Dec, 2012.
DOI: 10.1109/TVCG.2012.286
The performance of massively parallel applications is often heavily impacted by the cost of communication among compute nodes. However, determining how to best use the network is a formidable task, made challenging by the ever increasing size and complexity of modern supercomputers. This paper applies visualization techniques to aid parallel application developers in understanding the network activity by enabling a detailed exploration of the flow of packets through the hardware interconnect. In order to visualize this large and complex data, we employ two linked views of the hardware network. The first is a 2D view, that represents the network structure as one of several simplified planar projections. This view is designed to allow a user to easily identify trends and patterns in the network traffic. The second is a 3D view that augments the 2D view by preserving the physical network topology and providing a context that is familiar to the application developers. Using the massively parallel multi-physics code pF3D as a case study, we demonstrate that our tool provides valuable insight that we use to explain and optimize pF3D’s performance on an IBM Blue Gene/P system.
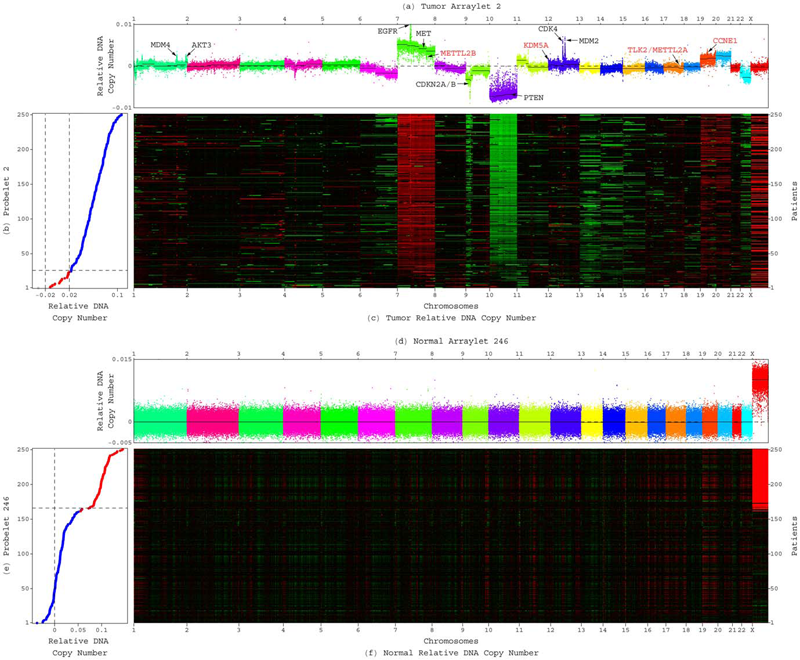
C.H. Lee, B.O. Alpert, P. Sankaranarayanan, O. Alter.
“GSVD Comparison of Patient-Matched Normal and Tumor aCGH Profiles Reveals Global Copy-Number Alterations Predicting Glioblastoma Multiforme Survival,” In PLoS ONE, Vol. 7, No. 1, Public Library of Science, pp. e30098. 2012.
DOI: 10.1371/journal.pone.0030098
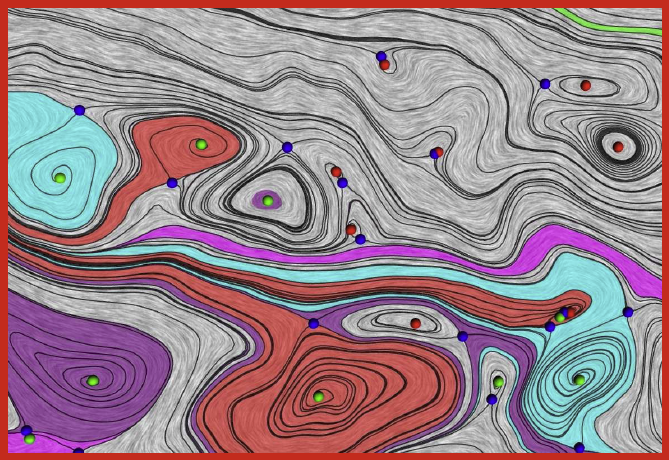
J.A. Levine, S. Jadhav, H. Bhatia, V. Pascucci, P.-T. Bremer.
“A Quantized Boundary Representation of 2D Flows,” In Computer Graphics Forum, Vol. 31, No. 3 Pt. 1, pp. 945--954. June, 2012.
DOI: 10.1111/j.1467-8659.2012.03087.x
A. Lex, M. Streit, H. Schulz, C. Partl, D. Schmalstieg, P.. Park, N. Gehlenborg.
“StratomeX: Visual Analysis of Large-Scale Heterogeneous Genomics Data for Cancer Subtype Characterization ,” In Computer Graphics Forum (EuroVis '12), Vol. 31, No. 3, pp. 1175--1184. 2012.
ISSN: 0167-7055
DOI: 10.1111/j.1467-8659.2012.03110.x
dentification and characterization of cancer subtypes are important areas of research that are based on the integrated analysis of multiple heterogeneous genomics datasets. Since there are no tools supporting this process, much of this work is done using ad-hoc scripts and static plots, which is inefficient and limits visual exploration of the data. To address this, we have developed StratomeX, an integrative visualization tool that allows investigators to explore the relationships of candidate subtypes across multiple genomic data types such as gene expression, DNA methylation, or copy number data. StratomeX represents datasets as columns and subtypes as bricks in these columns. Ribbons between the columns connect bricks to show subtype relationships across datasets. Drill-down features enable detailed exploration. StratomeX provides insights into the functional and clinical implications of candidate subtypes by employing small multiples, which allow investigators to assess the effect of subtypes on molecular pathways or outcomes such as patient survival. As the configuration of viewing parameters in such a multi-dataset, multi-view scenario is complex, we propose a meta visualization and configuration interface for dataset dependencies and data-view relationships. StratomeX is developed in close collaboration with domain experts. We describe case studies that illustrate how investigators used the tool to explore subtypes in large datasets and demonstrate how they efficiently replicated findings from the literature and gained new insights into the data.
J. Li, D. Xiu.
“Computation of Failure Probability Subject to Epistemic Uncertainty,” In SIAM Journal on Scientific Computing, Vol. 34, No. 6, pp. A2946--A2964. 2012.
DOI: 10.1137/120864155
Computing failure probability is a fundamental task in many important practical problems. The computation, its numerical challenges aside, naturally requires knowledge of the probability distribution of the underlying random inputs. On the other hand, for many complex systems it is often not possible to have complete information about the probability distributions. In such cases the uncertainty is often referred to as epistemic uncertainty, and straightforward computation of the failure probability is not available. In this paper we develop a method to estimate both the upper bound and the lower bound of the failure probability subject to epistemic uncertainty. The bounds are rigorously derived using the variational formulas for relative entropy. We examine in detail the properties of the bounds and present numerical algorithms to efficiently compute them.
Keywords: failure probability, uncertainty quantification, epistemic uncertainty, relative entropy
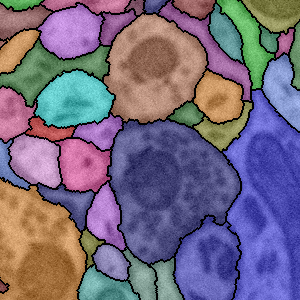
T. Liu, E. Jurrus, M. Seyedhosseini, M. Ellisman, T. Tasdizen.
“Watershed Merge Tree Classification for Electron Microscopy Image Segmentation,” In Proceedings of the 21st International Conference on Pattern Recognition (ICPR), pp. 133--137. 2012.
S. Liu, J.A. Levine, P.-T. Bremer, V. Pascucci.
“Gaussian Mixture Model Based Volume Visualization,” In Proceedings of the IEEE Large-Scale Data Analysis and Visualization Symposium 2012, Note: Received Best Paper Award, pp. 73--77. 2012.
DOI: 10.1109/LDAV.2012.6378978

Keywords: Uncertainty Visualization, Volume Rendering, Gaussian Mixture Model, Ensemble Visualization
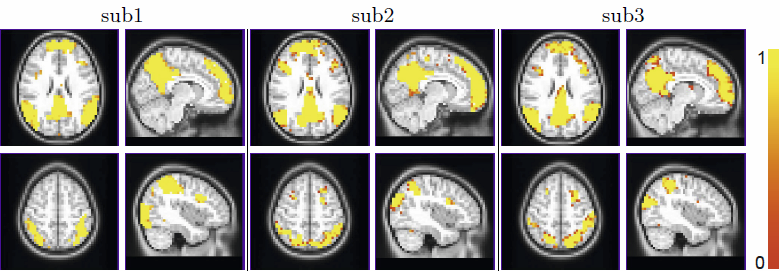
W. Liu, S. Awate, P.T. Fletcher.
“Group Analysis of Resting-State fMRI by Hierarchical Markov Random Fields,” In Medical Image Computing and Computer-Assisted Intervention – MICCAI 2012, Lecture Notes in Computer Science (LNCS), Vol. 7512, pp. 189--196. 2012.
ISBN: 978-3-642-33453-5
DOI: 10.1007/978-3-642-33454-2_24
Y. Livnat, T.-M. Rhyne, M. Samore.
“Epinome: A Visual-Analytics Workbench for Epidemiology Data,” In IEEE Computer Graphics and Applications, Vol. 32, No. 2, pp. 89--95. 2012.
ISSN: 0272-1716
DOI: 10.1109/MCG.2012.31
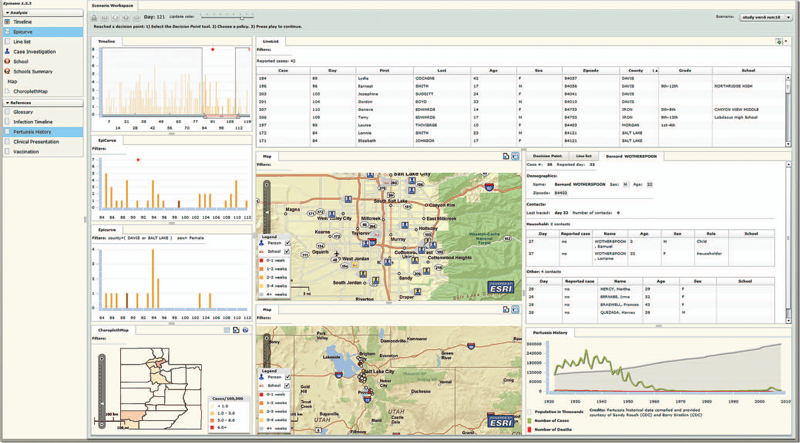
Effective detection of and response to infectious disease outbreaks depend on the ability to capture and analyze information and on how public health officials respond to this information. Researchers have developed various surveillance systems to automate data collection, analysis, and alert generation, yet the massive amount of collected data often leads to information overload. To improve decision-making in outbreak detection and response, it's important to understand how outbreak investigators seek relevant information. Studying their information-search strategies can provide insight into their cognitive biases and heuristics. Identifying the presence of such biases will enable the development of tools that counter balance them and help users develop alternative scenarios.
We implemented a large-scale high-fidelity simulation of scripted infectious-disease outbreaks to help us study public health practitioners' information- search strategies. We also developed Epinome, an integrated visual-analytics investigation system. Epinome caters to users' needs by providing a variety of investigation tools. It facilitates user studies by recording which tools they used, when, and how. (See the video demonstration of Epinome at www.sci.utah.edu/gallery2/v/ software/epinome.) Epinome provides a dynamic environment that seamlessly evolves and adapts to user tasks and needs. It introduces four userinteraction paradigms in public health:
• an evolving visual display,
• seamless integration between disparate views,
• loosely coordinated multiple views, and
• direct interaction with data items.
Using Epinome, users can replay simulation scenarios, investigate an unfolding outbreak using a variety of visualization tools, and steer the simulation by implementing different public health policies at predefined decision points. Epinome records user actions, such as tool selection, interactions with each tool, and policy changes, and stores them in a database for postanalysis. A psychology team can then use that information to study users' search strategies.
H. Lu, M. Berzins, C.E. Goodyer, P.K. Jimack.
“Adaptive High-Order Discontinuous Galerkin Solution of Elastohydrodynamic Lubrication Point Contact Problems,” In Advances in Engineering Software, Vol. 45, No. 1, pp. 313--324. 2012.
DOI: 10.1016/j.advengsoft.2011.10.006
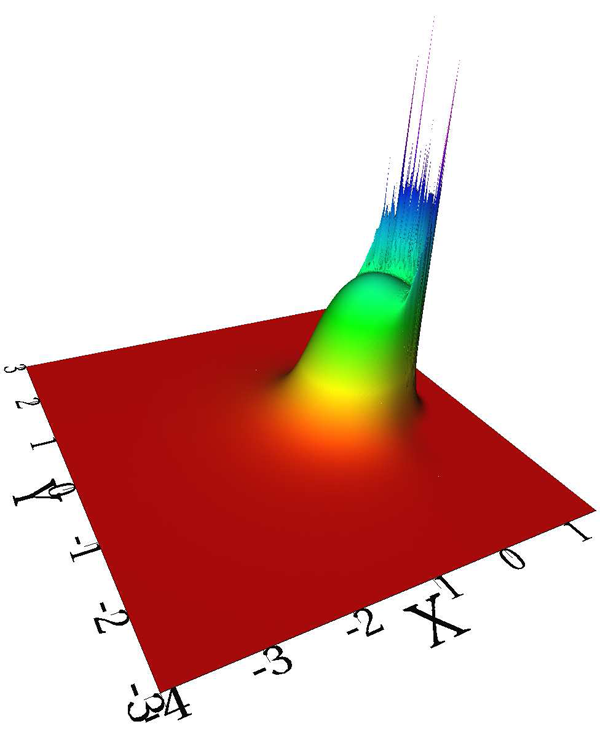
Keywords: Elastohydrodynamic lubrication, Discontinuous Galerkin, High polynomial degree, h-adaptivity, Nonlinear systems
A.E. Lyall, S. Woolson, H.M. Wolf, B.D. Goldman, J.S. Reznick, R.M. Hamer, W. Lin, M. Styner, G. Gerig, J.H. Gilmore.
“Prenatal isolated mild ventriculomegaly is associated with persistent ventricle enlargement at ages 1 and 2,” In Early Human Development, Elsevier, pp. (in press). 2012.
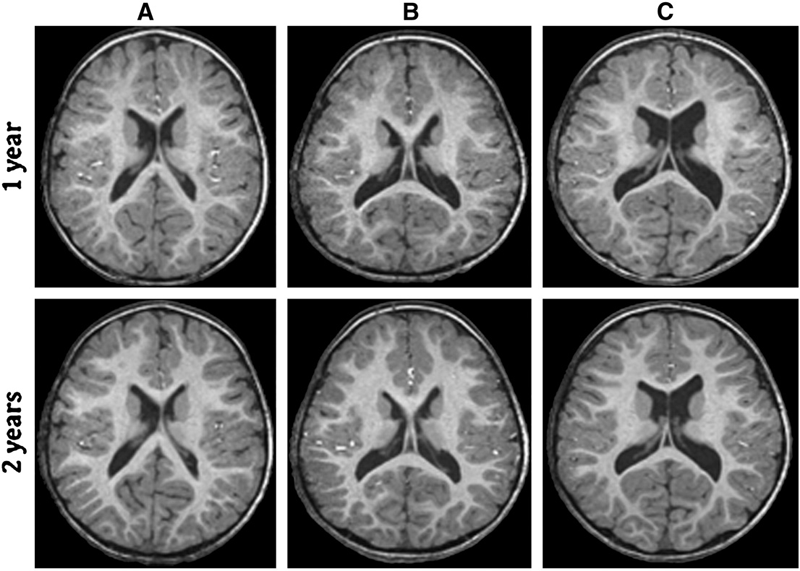
Background: Enlargement of the lateral ventricles is thought to originate from abnormal prenatal brain development and is associated with neurodevelopmental disorders. Fetal isolated mild ventriculomegaly (MVM) is associated with the enlargement of lateral ventricle volumes in the neonatal period and developmental delays in early childhood. However, little is known about postnatal brain development in these children.
Methods: Twenty-eight children with fetal isolated MVM and 56 matched controls were followed at ages 1 and 2 years with structural imaging on a 3T Siemens scanner and assessment of cognitive development with the Mullen Scales of Early Learning. Lateral ventricle, total gray and white matter volumes, and Mullen cognitive composite scores and subscale scores were compared between groups.
Results: Compared to controls, children with prenatal isolated MVM had significantly larger lateral ventricle volumes at ages 1 and 2 years. Lateral ventricle volume at 1 and 2 years of age was significantly correlated with prenatal ventricle size. Enlargement of the lateral ventricles was associated with increased intracranial volumes and increased gray and white matter volumes. Children with MVM had Mullen composite scores similar to controls, although there was evidence of delay in fine motor and expressive language skills.
Conclusions: Children with prenatal MVM have persistent enlargement of the lateral ventricles through the age of 2 years; this enlargement is associated with increased gray and white matter volumes and some evidence of delay in fine motor and expressive language development. Further study is needed to determine if enlarged lateral ventricles are associated with increased risk for neurodevelopmental disorders.
S.A. Maas, B.J. Ellis, G.A. Ateshian, J.A. Weiss.
“FEBio: Finite elements for biomechanics,” In Journal of Biomechanical Engineering, Vol. 134, No. 1, pp. 011005. 2012.
DOI: 10.1115/1.4005694
PubMed ID: 22482660

T. Martin, G. Chen, S. Musuvathy, E. Cohen, C.D. Hansen.
“Generalized Swept Mid-structure for Polygonal Models,” In Computer Graphics Forum, Vol. 31, No. 2 part 4, Wiley-Blackwell, pp. 805--814. May, 2012.
DOI: 10.1111/j.1467-8659.2012.03061.x
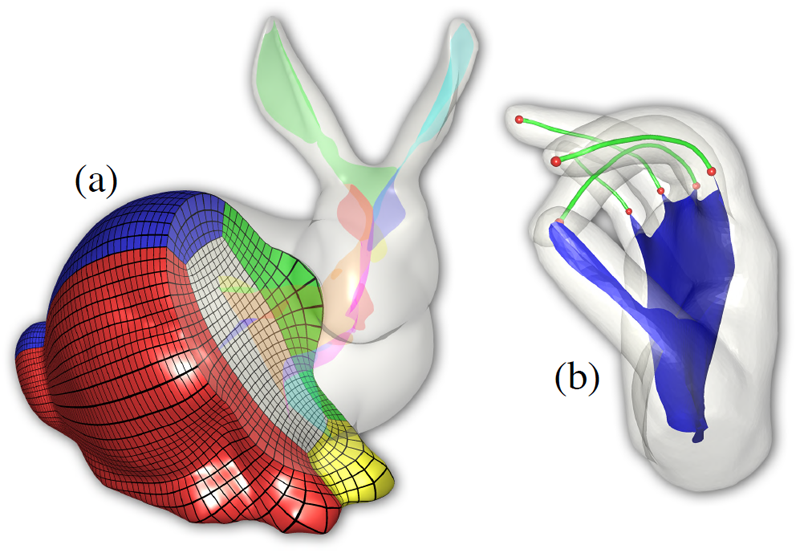
Keywords: scidac, kaust
K.S. McDowell, F. Vadakkumpadan, R. Blake, J. Blauer, G. Plank, R.S. MacLeod, N.A. Trayanova.
“Methodology for patient-specific modeling of atrial fibrosis as a substrate for atrial fibrillation,” In Journal of Electrocardiology, Vol. 45, No. 6, pp. 640--645. 2012.
DOI: 10.1016/j.jelectrocard.2012.08.005
PubMed ID: 22999492
PubMed Central ID: PMC3515859
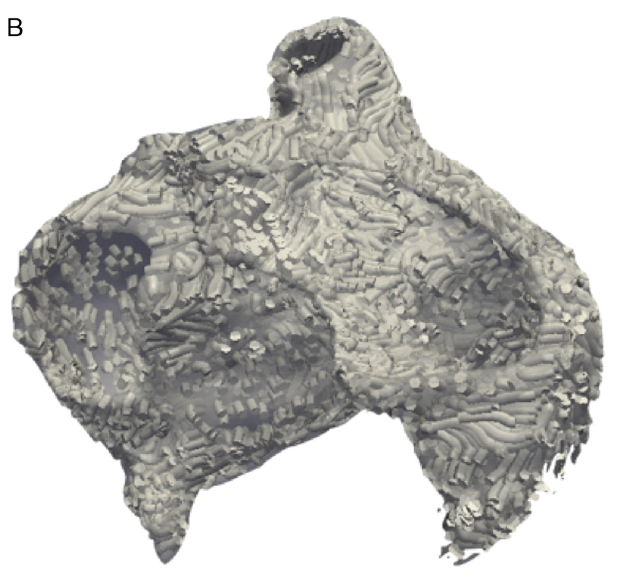
Keywords: Patient-specific modeling, Computational model, Atrial fibrillation, Atrial fibrosis
Q. Meng, M. Berzins.
“Scalable Large-scale Fluid-structure Interaction Solvers in the Uintah Framework via Hybrid Task-based Parallelism Algorithms,” SCI Technical Report, No. UUSCI-2012-004, SCI Institute, University of Utah, 2012.
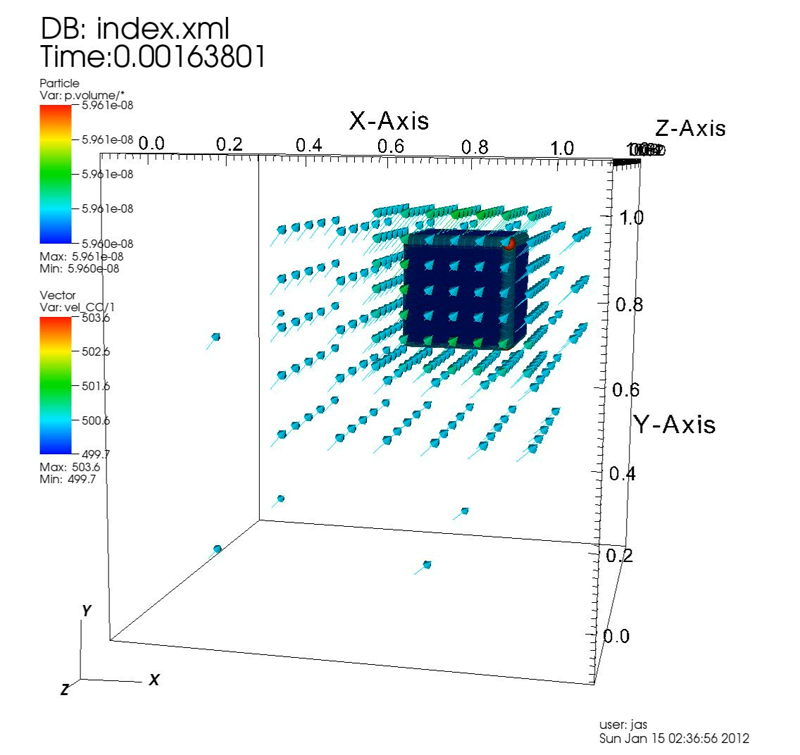
Keywords: uintah, csafe
Q. Meng, A. Humphrey, M. Berzins.
“The Uintah Framework: A Unified Heterogeneous Task Scheduling and Runtime System,” In Digital Proceedings of The International Conference for High Performance Computing, Networking, Storage and Analysis, Note: SC’12 –2nd International Workshop on Domain-Specific Languages and High-Level Frameworks for High Performance Computing, WOLFHPC 2012, pp. 2441--2448. 2012.
DOI: 10.1109/SCC.2012.6674233
The development of a new unified, multi-threaded runtime system for the execution of asynchronous tasks on heterogeneous systems is described in this work. These asynchronous tasks arise from the Uintah framework, which was developed to provide an environment for solving a broad class of fluid-structure interaction problems on structured adaptive grids. Uintah has a clear separation between its MPI-free user-coded tasks and its runtime system that ensures these tasks execute efficiently. This separation also allows for complete isolation of the application developer from the complexities involved with the parallelism Uintah provides. While we have designed scalable runtime systems for large CPU core counts, the emergence of heterogeneous systems, with additional on-node accelerators and co-processors presents additional design challenges in terms of effectively utilizing all computational resources on-node and managing multiple levels of parallelism. Our work addresses these challenges for Uintah by the development of new hybrid runtime system and Unified multi-threaded MPI task scheduler, enabling Uintah to fully exploit current and emerging architectures with support for asynchronous, out-of-order scheduling of both CPU and GPU computational tasks. This design coupled with an approach that uses MPI to communicate between nodes, a shared memory model on-node and the use of novel lock-free data structures, has made it possible for Uintah to achieve excellent scalability for challenging fluid-structure problems using adaptive mesh refinement on as many as 256K cores on the DoE Jaguar XK6 system. This design has also demonstrated an ability to run capability jobs on the heterogeneous systems, Keeneland and TitanDev. In this work, the evolution of Uintah and its runtime system is examined in the context of our new Unified multi-threaded scheduler design. The performance of the Unified scheduler is also tested against previous Uintah scheduler and runtime designs over a range of processor core and GPU counts.
Q. Meng, J. Hall, H. Rutigliano, X. Zhou, B.R. Sessions, R. Stott, K. Panter, C.J. Davies, R. Ranjan, D. Dosdall, R.S. MacLeod, N. Marrouche, K.L. White, Z. Wang, I.A. Polejaeva.
“30 Generation of Cloned Transgenic Goats with Cardiac Specific Overexpression of Transforming Growth Factor β1,” In Reproduction, Fertility and Development, Vol. 25, No. 1, pp. 162--163. 2012.
DOI: 10.1071/RDv25n1Ab30
Transforming growth factor β1 (TGF-β1) has a potent profibrotic function and is central to signaling cascades involved in interstitial fibrosis, which plays a critical role in the pathobiology of cardiomyopathy and contributes to diastolic and systolic dysfunction. In addition, fibrotic remodeling is responsible for generation of re-entry circuits that promote arrhythmias (Bujak and Frangogiannis 2007 Cardiovasc. Res. 74, 184–195). Due to the small size of the heart, functional electrophysiology of transgenic mice is problematic. Large transgenic animal models have the potential to offer insights into conduction heterogeneity associated with fibrosis and the role of fibrosis in cardiovascular diseases. The goal of this study was to generate transgenic goats overexpressing an active form of TGFβ-1 under control of the cardiac-specific α-myosin heavy chain promoter (α-MHC). A pcDNA3.1DV5-MHC-TGF-β1cys33ser vector was constructed by subcloning the MHC-TGF-β1 fragment from the plasmid pUC-BM20-MHC-TGF-β1 (Nakajima et al. 2000 Circ. Res. 86, 571–579) into the pcDNA3.1D V5 vector. The Neon transfection system was used to electroporate primary goat fetal fibroblasts. After G418 selection and PCR screening, transgenic cells were used for SCNT. Oocytes were collected by slicing ovaries from an abattoir and matured in vitro in an incubator with 5\% CO2 in air. Cumulus cells were removed at 21 to 23 h post-maturation. Oocytes were enucleated by aspirating the first polar body and nearby cytoplasm by micromanipulation in Hepes-buffered SOF medium with 10 µg of cytochalasin B mL–1. Transgenic somatic cells were individually inserted into the perivitelline space and fused with enucleated oocytes using double electrical pulses of 1.8 kV cm–1 (40 µs each). Reconstructed embryos were activated by ionomycin (5 min) and DMAP and cycloheximide (CHX) treatments. Cloned embryos were cultured in G1 medium for 12 to 60 h in vitro and then transferred into synchronized recipient females. Pregnancy was examined by ultrasonography on day 30 post-transfer. A total of 246 cloned embryos were transferred into 14 recipients that resulted in production of 7 kids. The pregnancy rate was higher in the group cultured for 12 h compared with those cultured 36 to 60 h [44.4\% (n = 9) v. 20\% (n = 5)]. The kidding rates per embryo transferred of these 2 groups were 3.8\% (n = 156) and 1.1\% (n = 90), respectively. The PCR results confirmed that all the clones were transgenic. Phenotype characterization [e.g. gene expression, electrocardiogram (ECG), and magnetic resonance imaging (MRI)] is underway. We demonstrated successful production of transgenic goat via SCNT. To our knowledge, this is the first transgenic goat model produced for cardiovascular research.
Page 54 of 144
